A neighbour's journey to solar

We put solar on our own roof first. Then we measured it, every half hour, for three and a half years.

This is the page where Dr Tom Weller opens up his own installation, panel-by-panel production, every cloudy morning and every August peak, and offers you a live 30-minute design session built on what he learned.

Lifetime, measured
19.4 MWh
Years of data
3.5
Best year (so far)
2025
The roof we know best

Before we sold a single panel, we put them on our own house.

Dr Tom Weller commissioned a tier 1 Korean panel array on his family home, installed by Chris Plaster, with SolarEdge power optimisers under every module and a single SolarEdge inverter at the heart of it. The brief he gave the installer was the same brief he now gives himself: design honestly, monitor everything, and let the roof tell the truth.

Three and a half years on, that roof has produced 19.4 MWh of measured electricity, not a regional estimate, not a manufacturer's brochure number, but half-hourly, panel-level data from a house in your neighbourhood. It's covered between 48% and 49% of a heavy household demand straight from the sun, and 2025 was the strongest year of the lot.

Everything you'll see on this page, the yearly totals, the north-versus-south revelation, the wave-form of a British day, comes from that single house. It's the dataset we sit on whenever we sketch a layout for a neighbour.
The hard proof

Three British years, measured to the panel.

Most solar quotes start with a regional estimate from a postcode. Ours starts with what's actually happened on a real roof, every half hour since spring 2023. 2025 was the strongest year, a useful reminder that British solar is not in decline; the kit gets better, the summers swing, and good design compounds.

2023 annual production summary from Dr Tom Weller's roof
2023
5.73 MWh

First full year. Covered 48% of a heavy 9.78 MWh household demand straight from the sun.

2024 annual production summary from Dr Tom Weller's roof
2024
5.36 MWh

A duller, wetter British year. Still offset 49% of grid dependence.

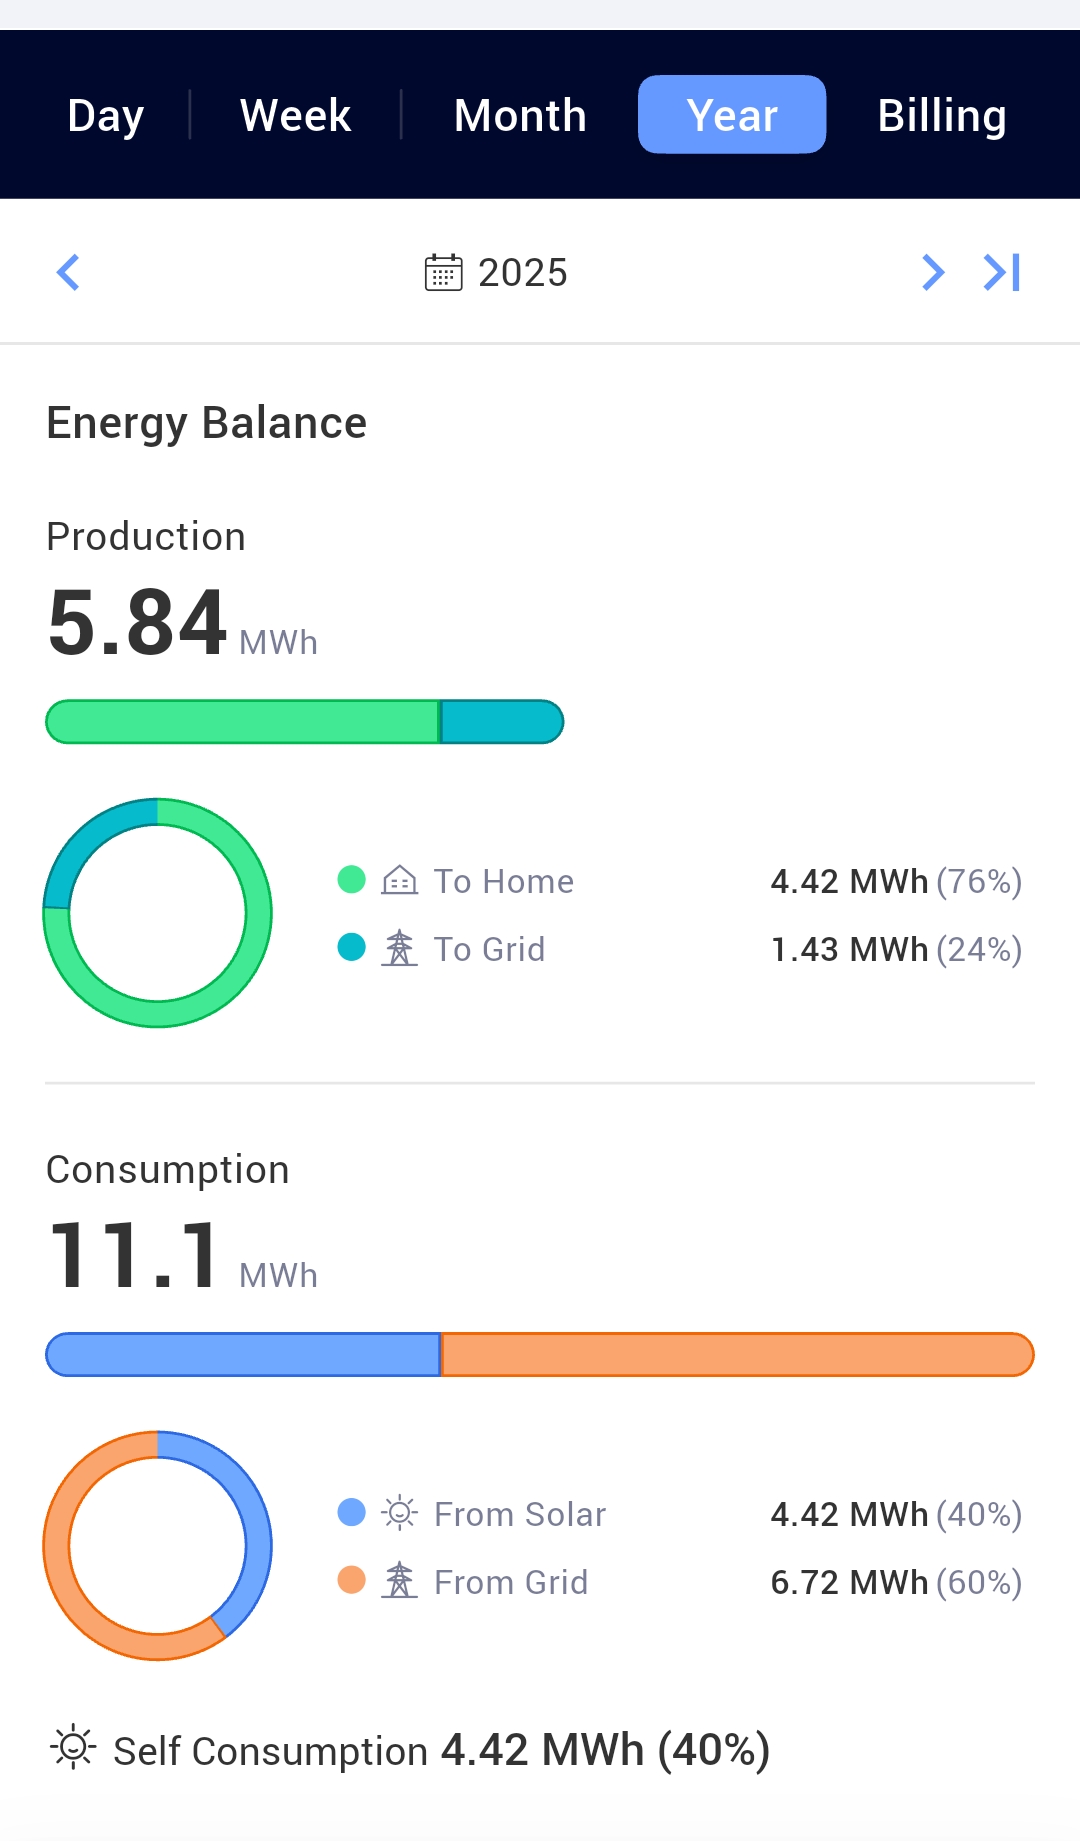
2025 annual production summary from Dr Tom Weller's roof
2025
5.84 MWh

The peak so far, out-produced both prior summers and pushed lifetime past the 19 MWh mark.

The revelation

North-facing roofs aren't the dead weight you've been told.

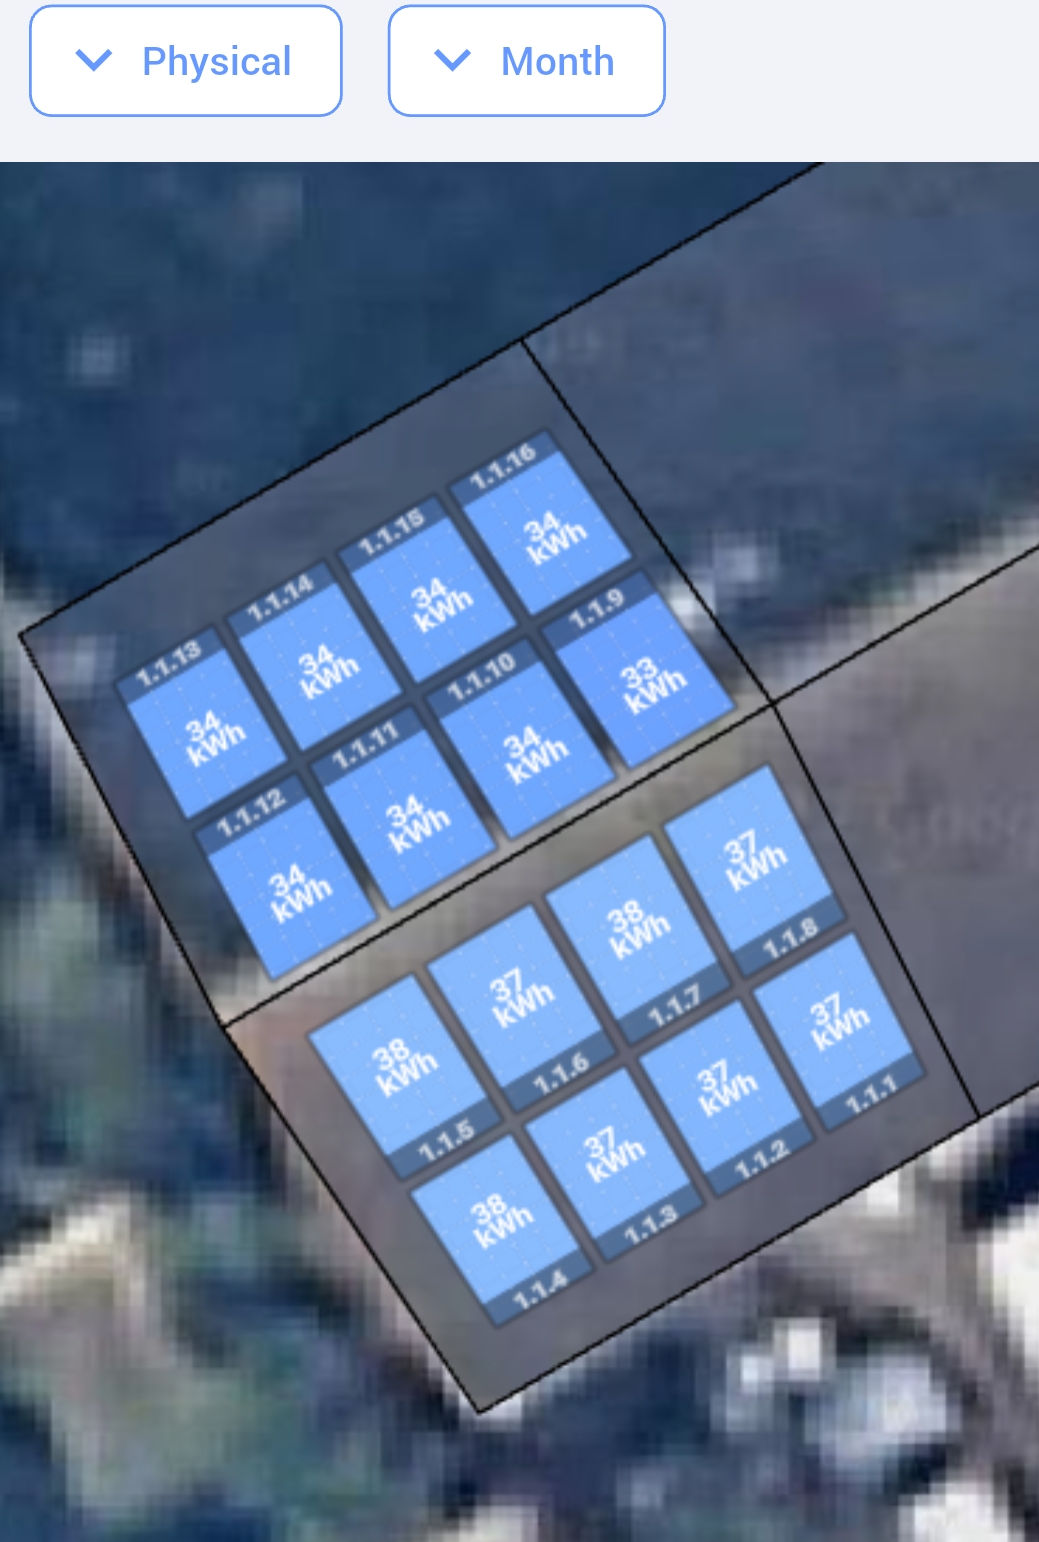
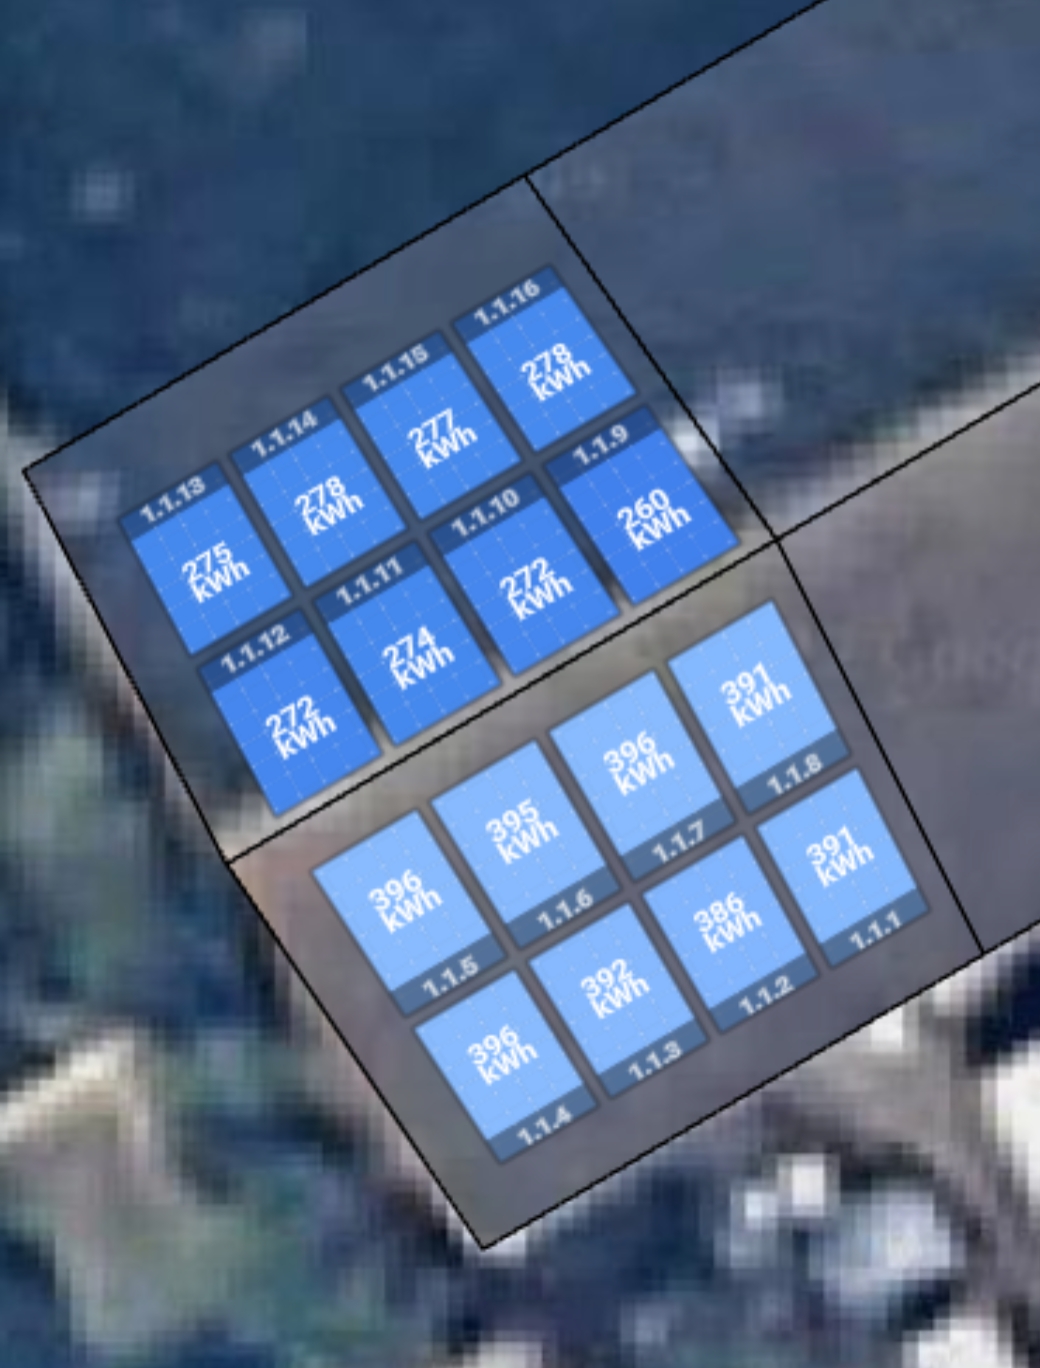
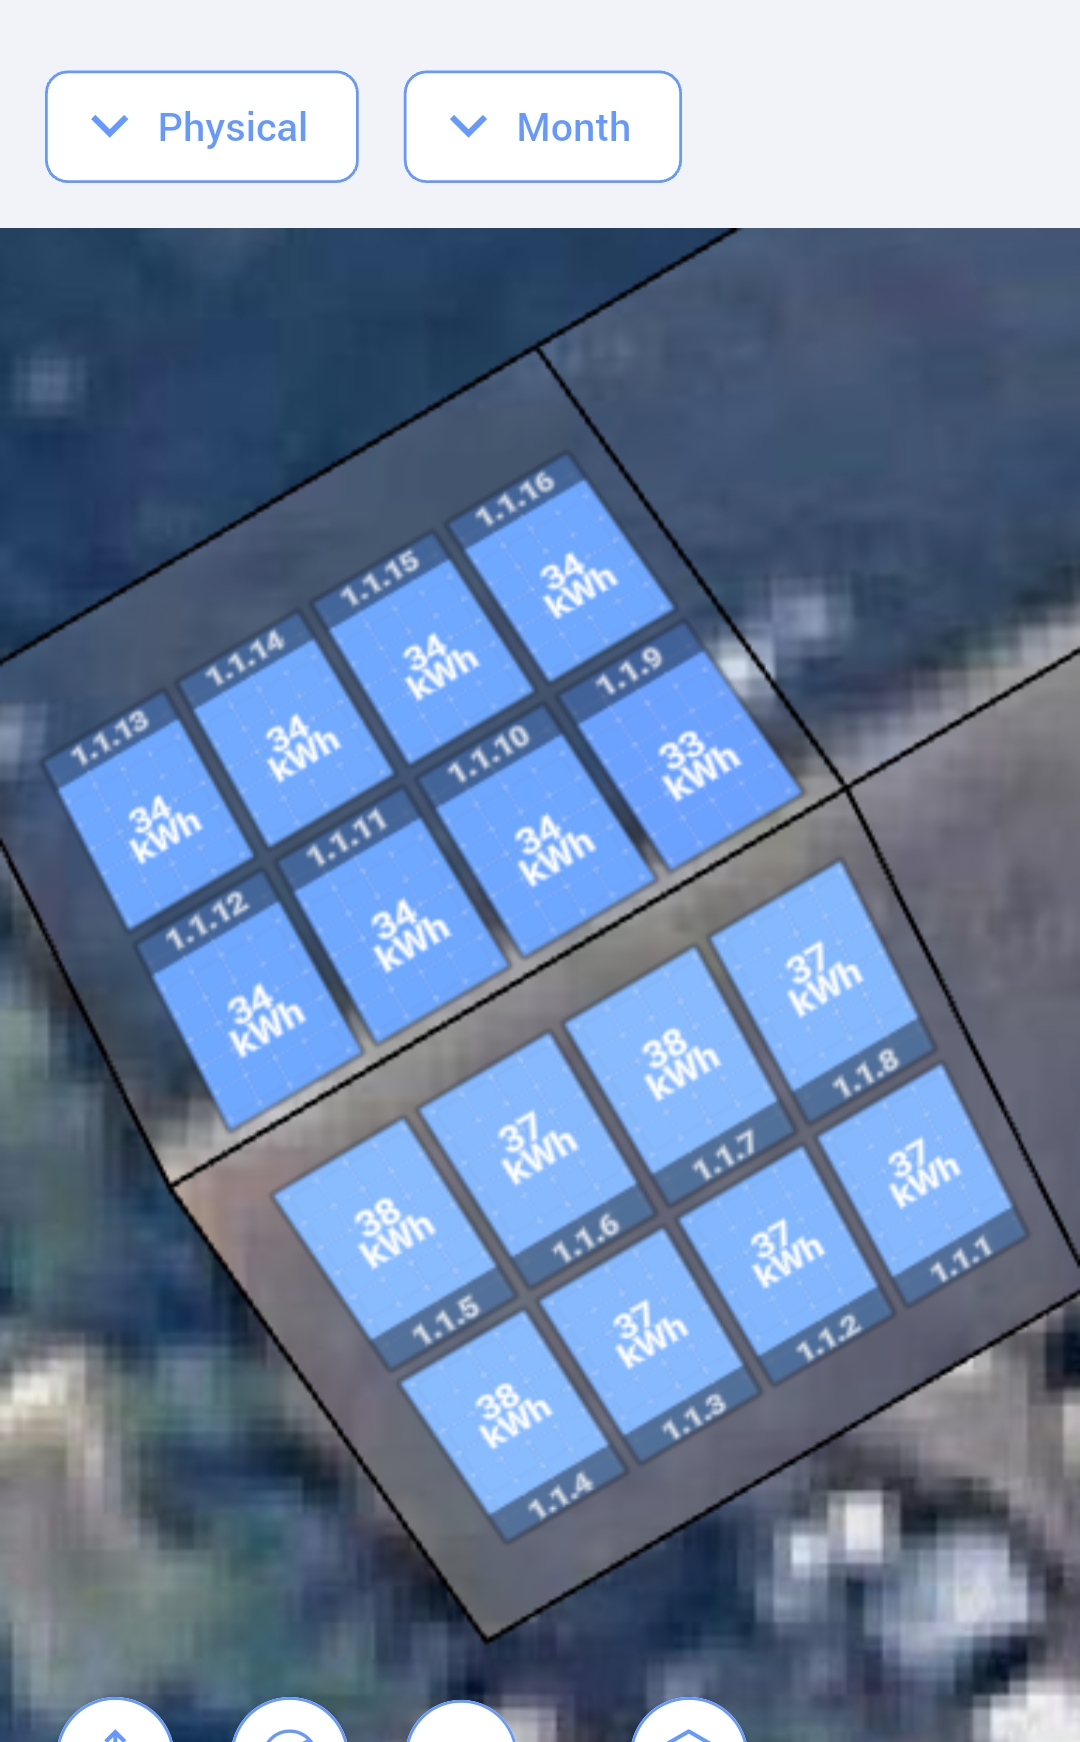
Conventional wisdom dismisses north-facing pitches out of hand. Our short-timescale, panel-by-panel data tells a more interesting story: on diffuse, overcast days the ratio between north and south facets is highly dynamic, and on some days the north panels collect more energy than the south.

"Cloud isn't the enemy of solar; it's just a different kind of sunlight. Per-panel optimisation lets every module do what it can, when it can, no single shaded panel holds the rest of the string back."
Panel-by-panel production data showing north vs south variation across a single day
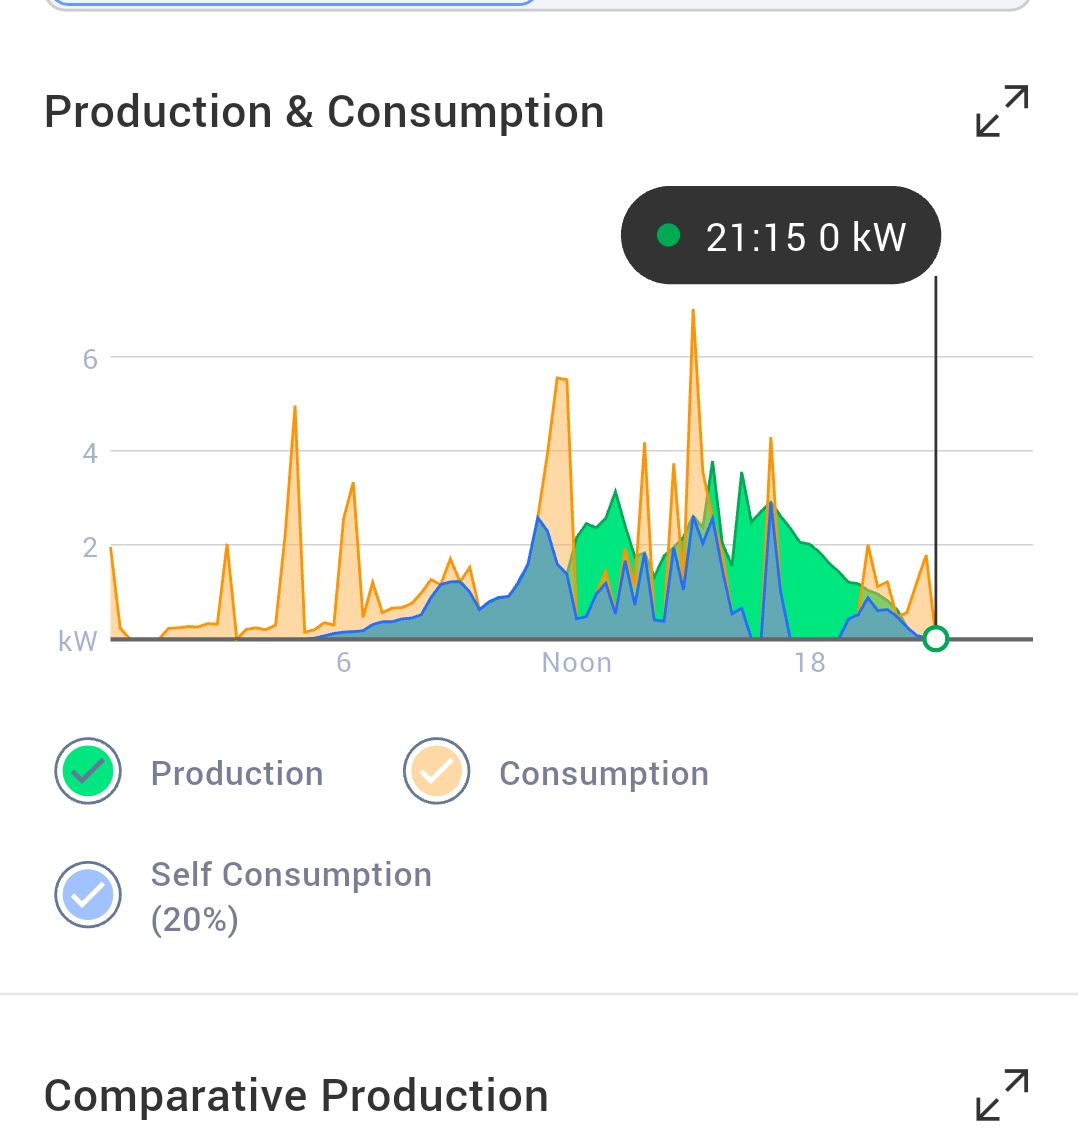
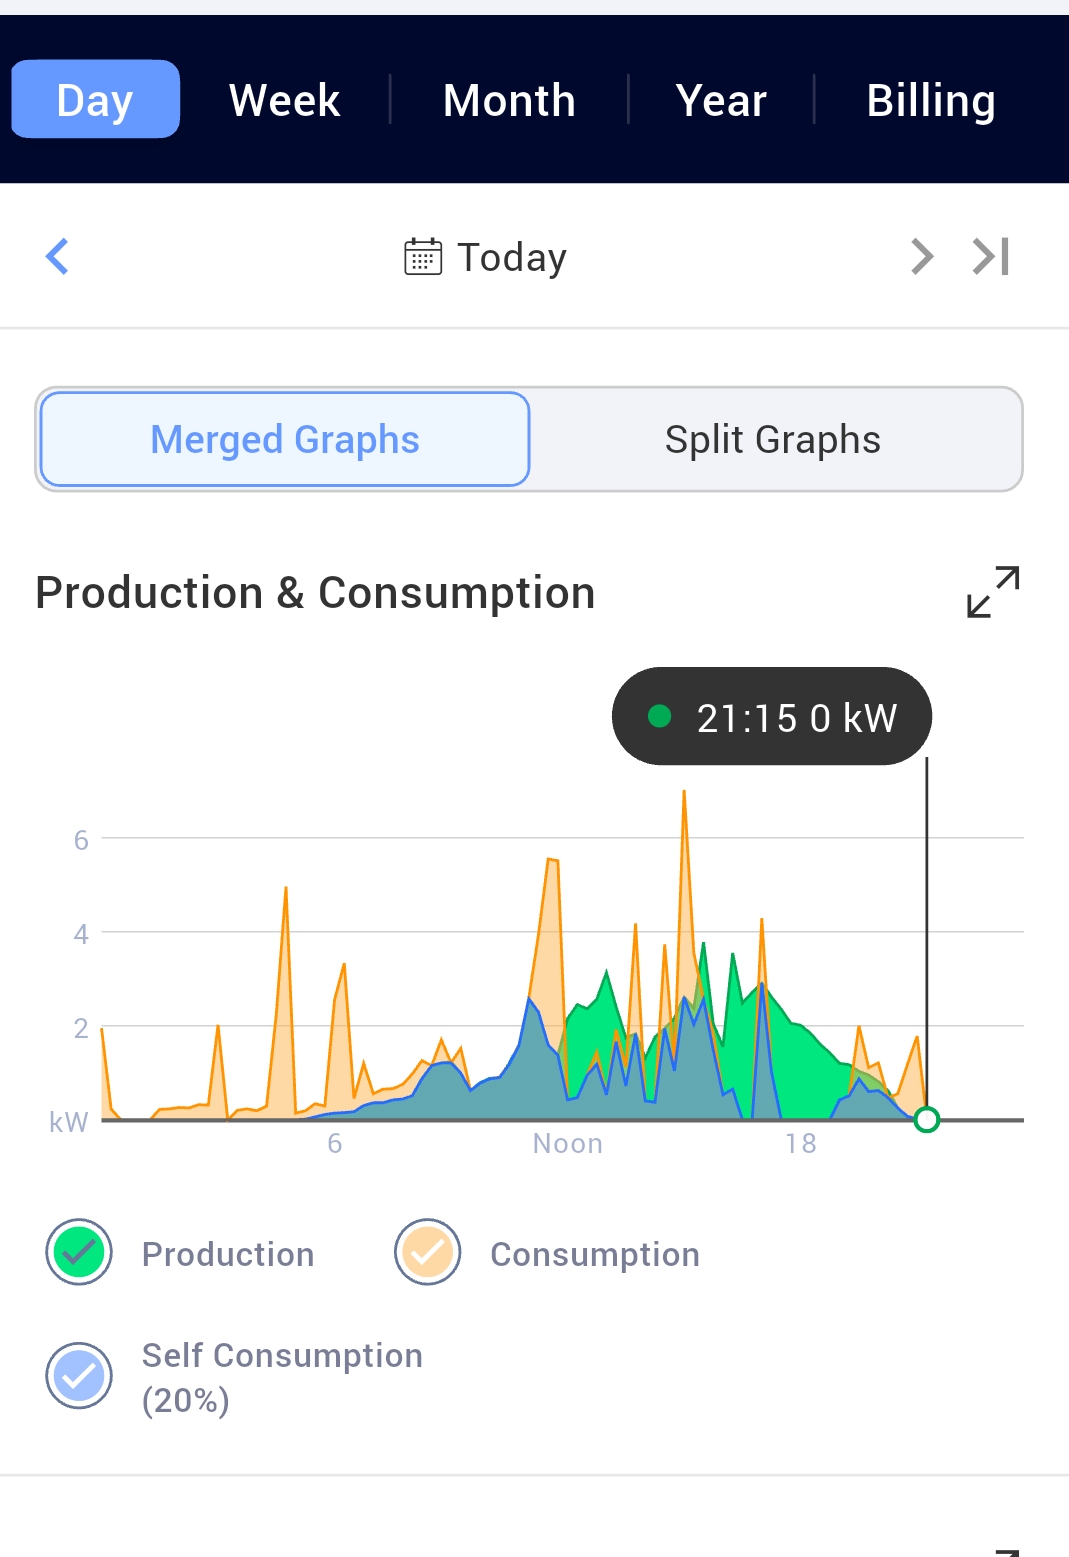
Alternate panel-level breakdown view
Optimizer-level diagnostic detail for an individual module
What we actually fit

Tier 1 Korean panels. SolarEdge brains. Designed live, in front of you.

Two manufacturers do almost all the heavy lifting on a Shires Energy installation, and they do different jobs.

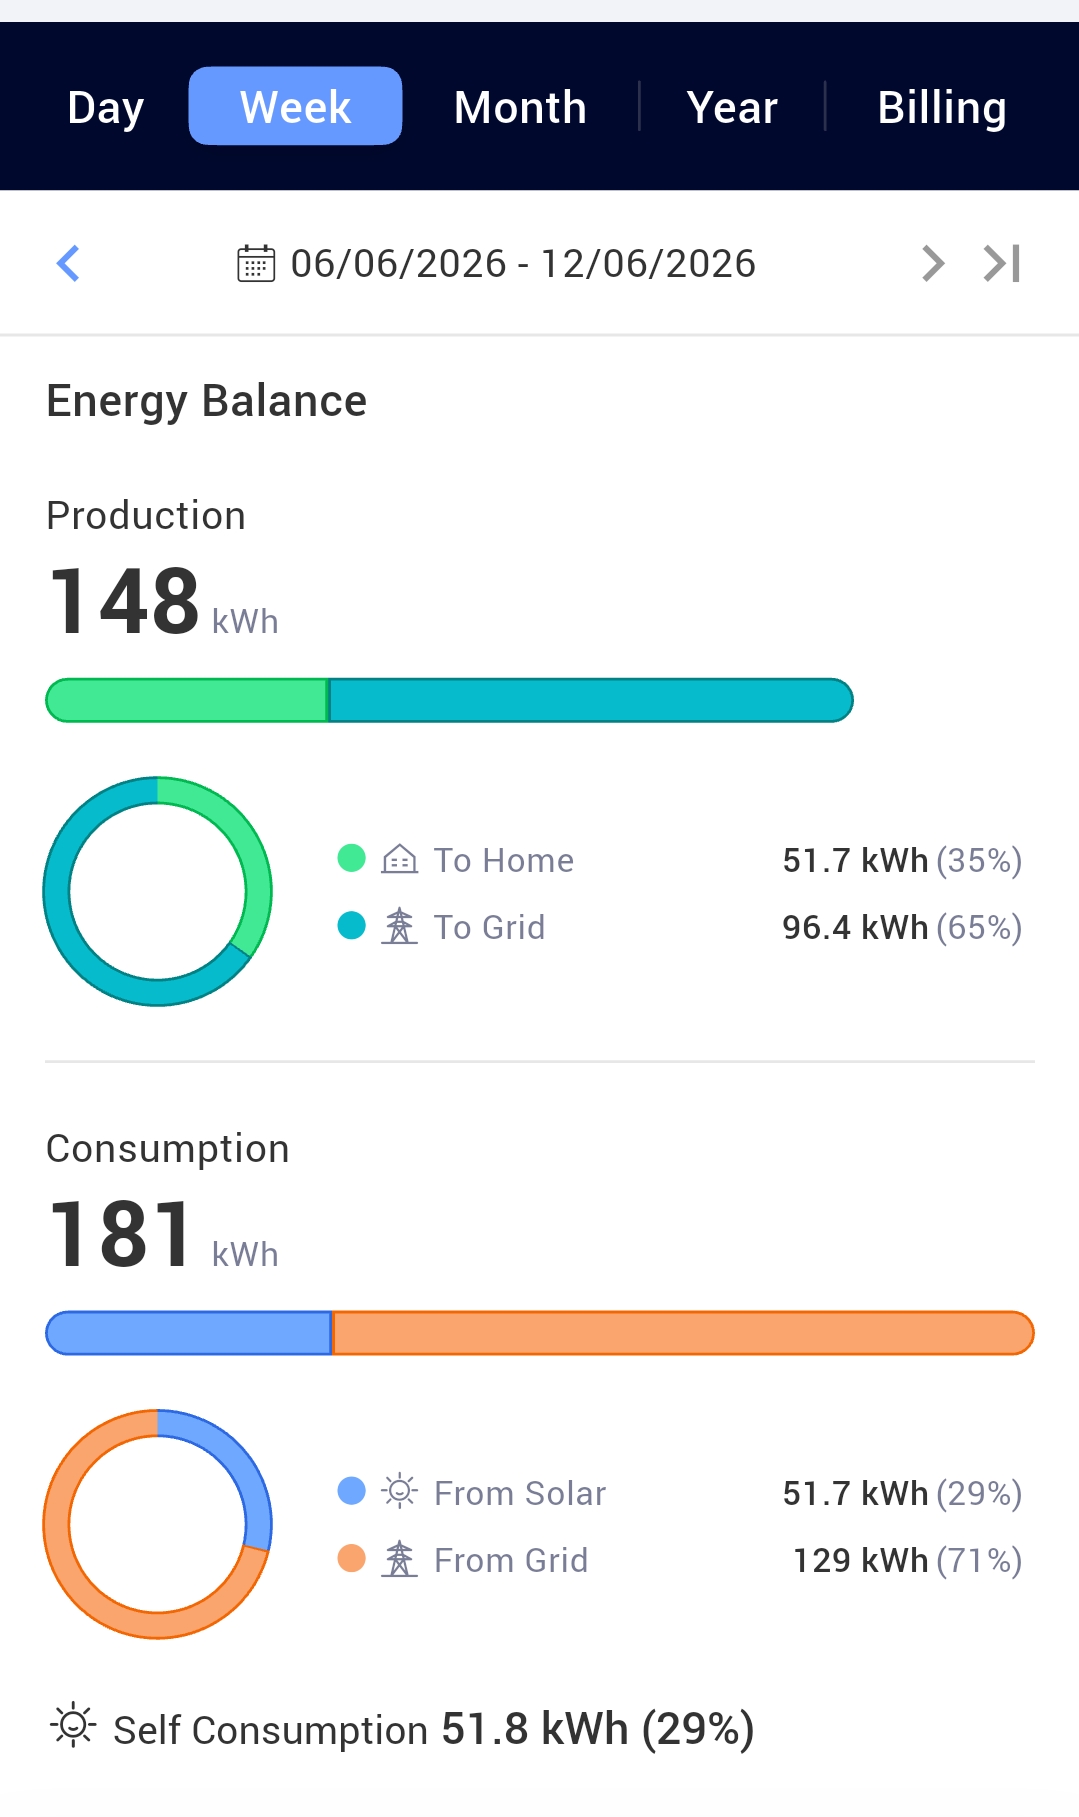
The SolarEdge monitoring environment, used as the design and diagnostic tool

Tier 1 Korean, the panels on the roof

Our default is a high-quality tier 1 panel, chosen for its engineering credentials and lifecycle performance. For ecological credentials we prefer Solarwatt, but we are not exclusive to any single brand and can adjust the panel maker for design reasons without compromising the qualities we look for. We always start the conversation here and only step away when you ask us to. We'll ask you about your specific priorities on the call.

SolarEdge, optimisers & inverter

A power optimiser under every panel, feeding a single SolarEdge inverter. Shade, dirt or a single bad module never drag the rest of the array down.

The York Minster standard

SafeDC™ panel-level shutdown and SenseConnect thermal monitoring, the exact safety architecture trusted on an 800-year-old Gothic cathedral. Read the York Minster paper →

SolarEdge as our design tool

We design every roof inside the SolarEdge environment, the same software that then monitors the finished installation. The design call and the lifetime audit run on the same screen.

You can audit us

You get portal access to the same dashboards we use ourselves. Nothing hidden behind a sales team or an account manager.

The 30-minute blueprint

A live design session, not a sales pitch.

We open Google Earth, satellite imagery and the SolarEdge design tools while you watch. Together we sketch the layout that fits your roof, your shading and your consumption. It's an incredibly accurate first guide, formally confirmed later via real bills, physical site dimensions, or a precision drone survey.

  • HD Google Meet. You can join from a phone, but a desktop or laptop is honestly better, the satellite view and the panel layout deserve the screen real estate.
  • 30 minutes is enough to get a serious first answer.
  • A quiet Gemini AI note-taker handles documentation so you can focus on the design, not the typing.
  • The booking syncs directly with Tom's calendar at tom@shiresenergy.com, no lost requests.
What we'll ask for*

We only ask for your name, email, mobile and postcode online. Full address and roof details are collected in person at the site visit.

What we cover in 30 minutes
  1. 01Pull up your roof on satellite and walk it together.
  2. 02Sketch a panel layout that respects shading, pitch and aesthetics.
  3. 03Talk through panel choices, SolarWatt by default, or tuned for budget, and what matters to you.
  4. 04Model expected production against 3.5 years of real local data.
Share or save

Scan to share or book on mobile

Hand a phone over the table, scan, and you've got the booking page in your pocket.

A preview of what we'll build together

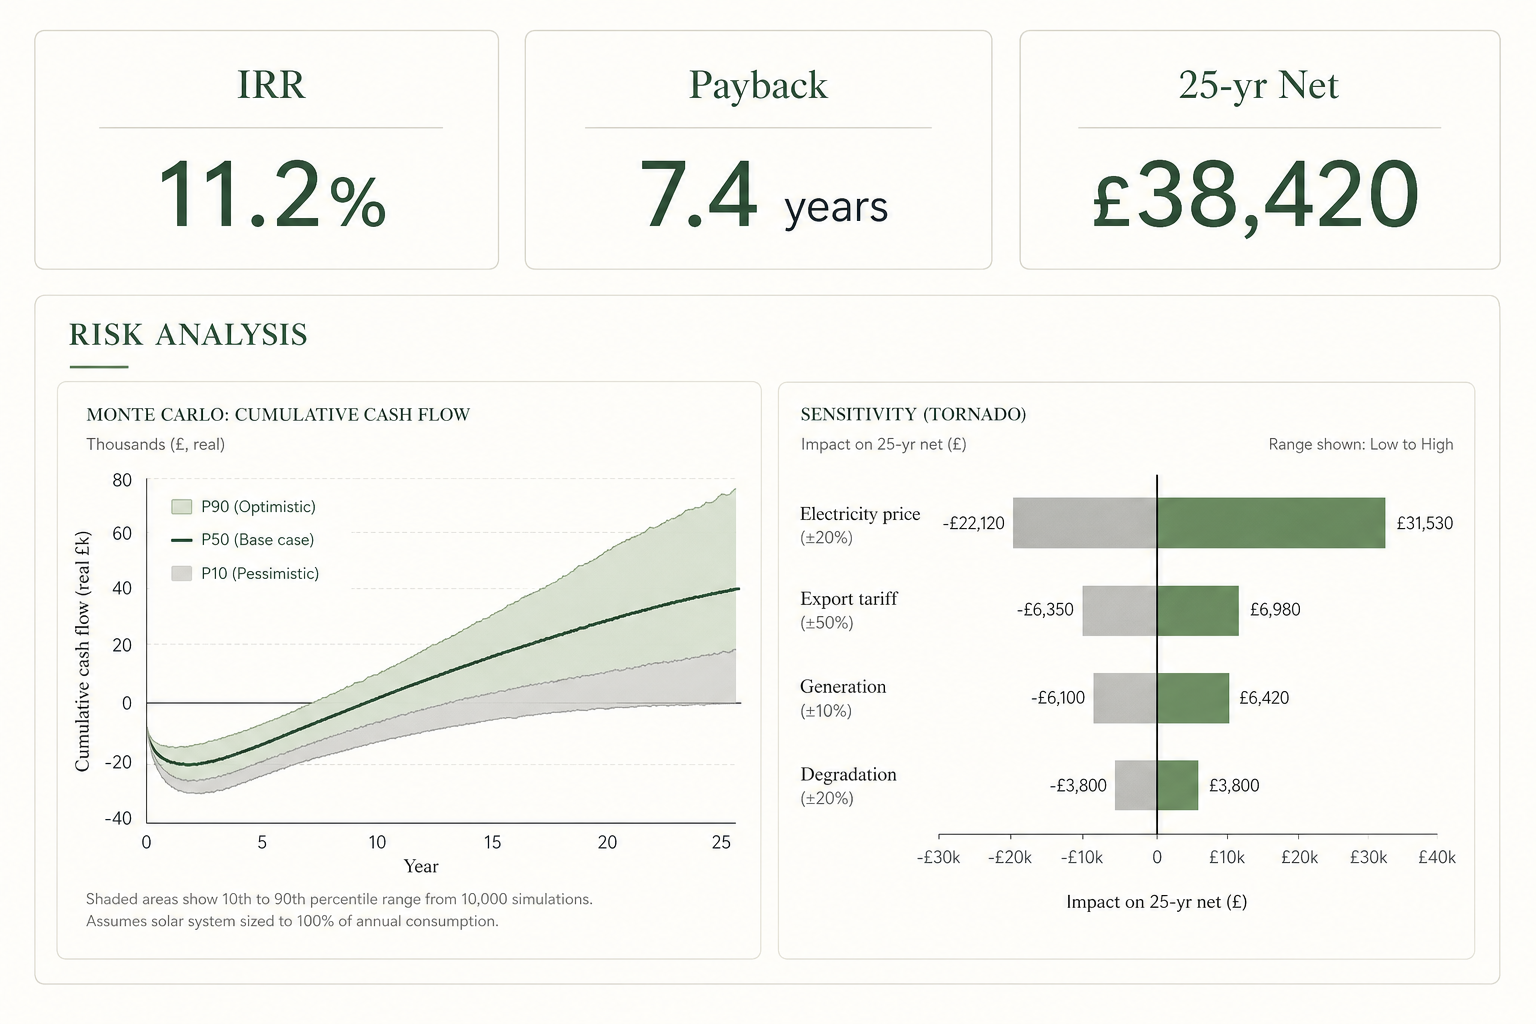
A financial model of your roof, IRR, payback, and the risk around both.

By the end of the call you'll have something like this, internal rate of return, time to payback, and a Monte Carlo risk analysis showing how the numbers hold up against electricity prices, export tariffs, generation, and degradation. Not a regional average. Yours.

Sample financial model: IRR, payback, and Monte Carlo risk analysis

The model is built from your actual half-hourly usage, something we'll walk you through gathering once the blueprint is underway.